Let's Discuss
Enquire NowPROJECT DESCRIPTION
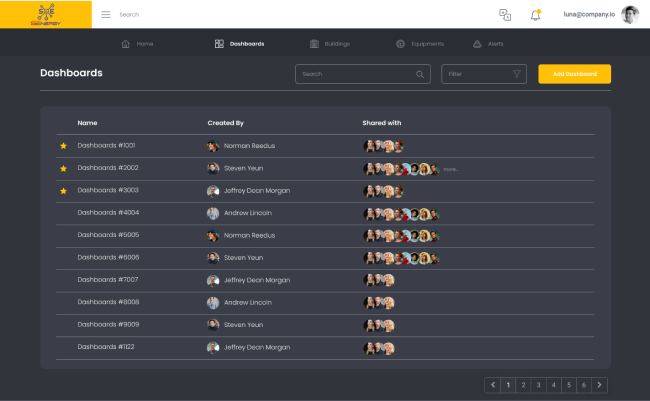
- A multi-tenant system that can track energy consumption at different levels of granularity.
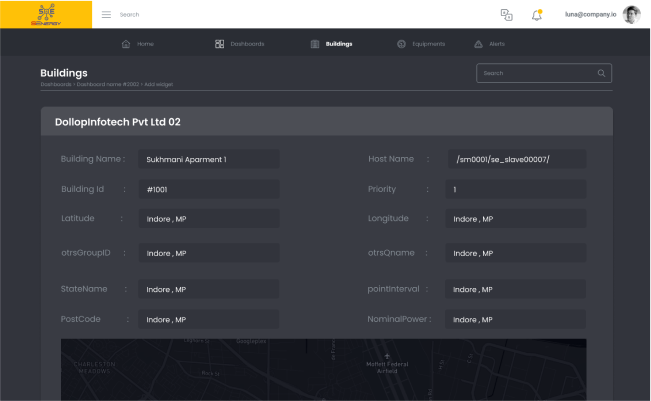
- Ability to aggregate power usage per customer, building, equipment type, or equipment level.
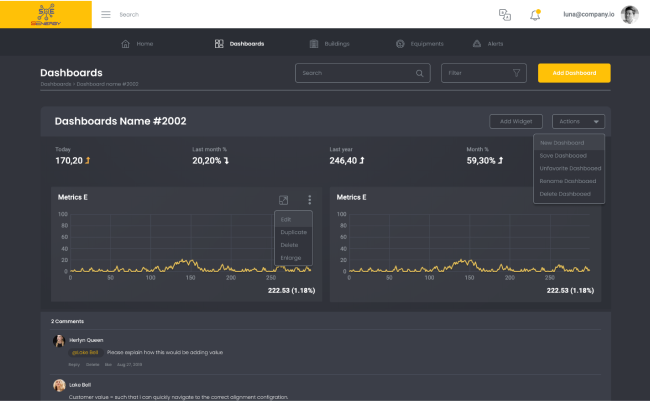
- Ability to dynamically configure visualization charts and add them to the dashboard.
- Ability to manage users, user roles, and set up user privileges.
- It provides a sandbox in the form of notebooks whereby users can test their submissions against live data.
- Capability to host a competition where the data can be shared with the crowd and external users can come up with solutions according to the goal of the competition.
- Dynamic leaderboard computation based on the application of user solutions against live data.
SOLUTIONS
- A kappa architecture system where ingestion from the edge device is done with consistency. The ingestion component was built using Java and supports a queueing mechanism.
- Data is processed using Apache Spark and stored in MongoDB as a data store.
- Processed data is accessible via REST APIs developed using Node.js
- Customized Cube.js to enable a miniature data visualization platform within the application itself. This gave the user the ability to create their own charts and publish them against buildings/equipment.
- A PassportJS-based authentication system, wherein user access to each entity is controlled from the admin interface.
- Jupyter notebook was integrated into the application to enable users to work on the published data within the environment itself. This enabled users to perform ML analysis within the environment itself.
- Submitted solutions get evaluated on live data and the leaderboard gets recomputed at regular intervals.
KEY TECHNOLOGIES
- Java 8
- Apache Kafka
- MongoDB
- Apache Spark
- Node.JS with Express
- Cube.JS
- Passport.JS
- Jupyter Notebook
- Docker
