Let's Discuss
Enquire NowAs the city’s population continues to grow, traffic management is becoming more demanding and sustainable transportation systems are becoming even more important. A good traffic model can accurately and efficiently represent traffic conditions. The main goal is to use IoT to create an efficient traffic management system. Adjust your transportation system with an Arduino controller and IR sensors. According to research, traffic lights are the main cause of traffic congestion. Poorly managed traffic lights not only triple fuel consumption but can also lead to CO2 emissions and various other pollutant emissions.
V2IoT APPROACH
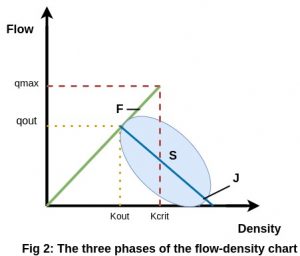
Boris Kerner presented the theory of three phases of transportation and modeled the transportation system that characterizes flowing traffic as one of three possible schemes. Each system has multiple configurations that correspond to configurations, locations, the presence of heavy and light congestion, and the increase or decrease in relationships with other configurations. This methodology is a quantitative approach that limits the explanation of what is happening on the road. This process allows you to identify useful recurring traffic patterns. This approach helps investigate and prevent traffic congestion. The main purpose is to physically explain the causes of worsening traffic conditions and congestion. Based on the theoretical and basic diagrams of traffic, Kerner’s theory allows three phases, as opposed to the classical theory, which identifies only two phases or regimes (traffic flow and congestion). .. Phases or regimes can be described as temporal and spatial states. Distinguish between fluid state and two overload regimes: sync rate and major congestion, the total number of overload schedules are three: fluid regime (F), sync regime (S), heavy traffic, and overload ( J). In the liquid region (F), a positive correlation is empirically observed between flow q (number of vehicles per time interval) and density k (number of vehicles per unit of space). This relationship is maintained up to an upper bound equal to the critical density Kcrit.
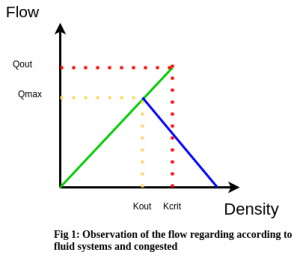
 In the Congested regime, as expected, the vehicle speed is lower than the minimal speed Vmin(free) = qmax / kcrit; the right side of the fluid regime illustrates this value for slope (right of Blue line in Fig. 1). The blue line divides the flow chart-density empirical data into two separate regions: the crowded regime on the right and the fluid regime on the left. It is deemed “major” congestion (Major MObile congestion(J)) when the width of the congestion (in the direction of flow) exceeds the width of his forehead.).In comparison to the fluid system, the typical vehicle speed is quite modest. Vehicles downstream from the front go at a considerably faster pace in the fluid regime. Frequently localised geographically, usually in a road narrowing.
Even if the speed has been significantly lowered, the flow rate can stay the same as that of the fluid system. The major congestion and synchronous flow are not the same. The three-phase theory of J. Kerner posits that the two-dimensional area in the flow density map is contained in the homogeneous state of the synchronous flow.
(Blue area in Fig. 2).
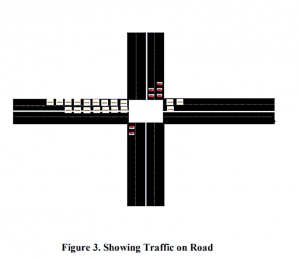
 Our goal is to investigate the synchronised regime of Kerner’s three phases of traffic theory in order to develop an autonomous and dynamic traffic light management system that ensures a smooth flow of traffic. One of the biggest drawbacks of the classic traffic light system is that it allows the same length of time for all traffic lights across the road, regardless of whether the traffic density on one road is more or lower than on the other. During certain times of the day, some routes may be completely devoid of traffic. Because the standard traffic signal does not have a mechanism to handle such a dynamic situation, it will give this road a green light even though there are no vehicles on it, obstructing the way that has traffic. As a result, traffic moves more slowly.
Solution
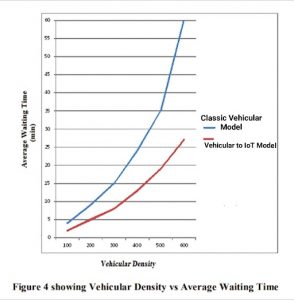
The Kerner technique classifies road conditions into three categories: fluid regime (F), crowded system (J), and synchronised system (S) (S). Any clogged system can be transformed into a synchronised system with the right remedy. For example, if two crossing roads R(1) and R(2) are congested, road R(1) should be closed. The green light will then be overridden by road R(1) till it becomes fluid, while the other road R(2) will remain in red light. The same may be said for Road R. (2). If R(2) becomes congested, it will take precedence over the green light until it becomes fluid, and vice versa. The Kerner approach uses two characteristics to determine the state of the network: traffic density and traffic flow. The Kerner method uses these two parameters to distinguish between flowing and congested traffic conditions. The proposed solution makes it possible to get a dynamic, real-time-based solution. To achieve the desired solution, Kerner’s method requires longer travel times, as shown in Figure 4. The Vehicular to IoT approach has clearly outperformed traditional vehicle networks and their communication systems. On applying a four-state solution we found that the average travel time of the vehicles reduced significantly compared to that in the case of classical vehicle management which clearly highlights the efficiency of our approach and solution. Based on the data it determines which road is in a congested state and which road is in a fluid state. The road that is in the congested state needs its traffic light should be in the green state and the road that is in a fluid state can switch its traffic light in the red state. The aim is then to ensure that the congested major state of the traffic doesn’t stay for long. This differentiation gives us four basic states of the congestion system namely, Fluid state, Synchronised state, Congested state, and Congested Major state.
Now a solution that uses a wireless sensor network connected to the central server that calculates the density of the traffic on a road and transmits this data to the Traffic light controller. The controller decides this dynamically based on the density of traffic on a particular road which light signal should be allowed to stay redder and which light signal should have more green signal so as to allow better flow of vehicles on road. This setup can be extended to the entire network of Traffic light signals via the internet so they can establish information exchange on the traffic flow, and can even direct vehicles to the lesser dense routes in case a traffic jam occurs on a particular route.
The vehicular to IoT approach delivers better performance as compared to the classical adopted methodology and shows significant advantages with respect to service features and optimisation provisioning in vehicular networks. As an opportunity vocation, plan to analyse lane changing times and the velocity total deviation to reduce the motivation of lane changing effectively. Lane changing not only often leads to traffic chaos but also increases the chances of accidents that happen on roads. If you would like to know more about our approaches regarding IOT, click here.
Disclaimer: The opinions expressed in this article are those of the author(s) and do not necessarily reflect the positions of Dexlock.


