Let's Discuss
Enquire NowLog Analytics and Log Management using ELK
Aug 23, 2022by, Rishikesh K B
Technology
Small things can sometimes lead to major issues. You make a decision that you believe will make things easier, but it may actually make things more difficult. Microservices are an example of this. You’re aware of the advantages of migrating from a monolithic to a microservices architecture. More flexibility and faster deployments are among them.
This is fine until you remember how much logging your monolithic application was doing. All of that log data was stored on one or a few of the app’s systems. In a microservices design, however, every instance of your application services logs data.
You’ll need a log management system to collect and store the information from all of these services. You’ll be able to find and analyze the data you require when you need it.
This is where the Elastic Stack will come to your rescue.
What exactly is the ELK Stack?
The ELK Stack is a collection of components that are used to monitor and observe your infrastructure. The ELK Stack allows you to handle all of your log data and analyze it in real-time.
The term “ELK” stands for the stack’s three initial open-source components: Elasticsearch, Logstash, and Kibana. Logstash ingests and collects log data from a variety of sources before sending it to Elasticsearch. Elasticsearch indexes the data it receives from Logstash so you can search and study it. Kibana can be used to pull data from Elasticsearch using a querying language for visualization, dashboarding, and other purposes.
The Elastic Stack is the ELK Stack’s next iteration. It also includes Beats, a component that can consume data in a similar way to Logstash but not as thoroughly. Beats is a little lighter.
Elasticsearch
Elasticsearch, based on Apache Lucene and released by Elastic in 2010, is a popular full-text search engine that powers the ELK or Elasticsearch stack. Elasticsearch may be used by DevOps teams to index, query, and analyze log data from many sources in complex IT settings, allowing them to support log management use cases such as security log analysis and troubleshooting cloud-based apps and services.
Logstash
Logstash is a server-side data processing pipeline that can ingest logs from a number of data sources, apply parsing and transformations to the log data, and deliver it to an Elasticsearch cluster for indexing and analysis. It was first published by Elastic in February 2016.
Kibana
Kibana is an open-source, browser-based data visualization application that connects with Elasticsearch in the ELK stack. It was first released in 2013. Users can use Kibana to look at aggregated log data stored in Elasticsearch indices.
Kibana may be used by DevOps teams to explore and analyze their log data, building visualizations and dashboards to aid analysts in consuming the data and extracting insights.
Beats
You can certainly imagine that receiving, transforming, and delivering all of this data through Logstash will cause performance concerns. The ELK Stack community came up with a few solutions, one of which became Beats.
Beats is a group of agents that are placed on your computer in order to collect a specific set of data. Elastic now produces eight different types of Beats, but the open-source community has created many more. It can be lighter and require fewer resources than Logstash because each beat has a specific role.
Each beat can capture a variety of information. Filebeat is used to manage log files, Functionbeat is used to manage serverless cloud infrastructure, Metricbeat is used to manage system metrics, and Packetbeat is used to manage network packets.
How to Analyze Logs with the ELK Stack?
As previously stated, the various components of the ELK Stack when combined provide a simple yet effective solution for log management and analytics.
The ELK Stack’s many components were created to interact and play pleasantly with one another without requiring too much extra configuration. However, depending on your environment and use case, how you design the stack will fluctuate significantly.
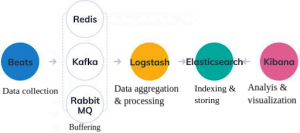
The classic architecture for a small development environment will look like this:
 Additional components for resiliency (Kafka, RabbitMQ, Redis) and security (Nginx) are likely to be added to your logging architecture for more complicated pipelines created for handling huge amounts of data in production:
 Of course, for the sake of example, this is a simplified diagram. Numerous Elasticsearch nodes, maybe multiple Logstash instances, an archiving mechanism, an alerting plugin, and full replication across regions or segments of your data centre for high availability are all part of a full production-grade design.
Why should you use the ELK Stack for log management and analytics?
The ELK stack has become a popular log management platform for enterprise organizations. Some of the reasons why so many DevOps teams utilize the ELK stack for logs are as follows:
- Logs are vital – For software-dependent enterprises, log analytics gives crucial visibility into IT assets and infrastructure, addressing use cases such as cloud service monitoring, DevOps application troubleshooting, and security analytics. ELK gives these enterprises the tools they need to keep track of their increasingly complex IT systems.
- Open Source Solution – Open-source software includes Elasticsearch, Kibana, and Logstash. That means they’re available for free download, and users can create plug-ins and extensions, as well as modify the source code. It’s simple for enterprises to start using the ELK stack for log analytics because there are no software licensing costs.
- Proven Use Cases – Some of the world’s largest and most well-known technological businesses, such as Netflix and LinkedIn, have employed the ELK stack for log management.
- It’s compatible with other systems – The ELK Stack is made up of four parts. You can combine many other tools you already have to do what one in the stack already does. The stack can be used together or separately. It can work with other tools to complete the task.
- It’s Managed – If you don’t have the time or don’t want to devote any effort to learning the ELK Stack, you can hire someone to do it for you. Elastic Stack’s creators offer a managed service that you may pay for. Elasticsearch is a service provided by Amazon Web Services. Other Elastic Stack providers also provide hosted Elastic Stack solutions. You can subscribe to a managed service and minimize your time to value if you have the money or don’t want to spend any time managing your ELK Stack.
Open Source ELK Stack or Commercial Tools: Which Would You Prefer?
As your business expands, so does the amount of data it generates. The ELK stack is the one for you if you’re searching for a good, scalable, and economical log management and analysis solution to help you make sense of your logs. It contains outstanding features that can hold their own against professional solutions. Not to mention the fact that you might not even require them.
Commercial technologies, such as Sematext Cloud, let you get started quickly. You don’t have to understand Elasticsearch or any of the capabilities on top, like access control, and you don’t have to be concerned about it. You’ll have more time to expand your business this way.
If ELK is closer to the heart of your business, on the other hand, it may be worthwhile to scale it with your operations team. Sematext provides ELK training, consultancy, and production support to assist you along this path.
However, keep in mind that the type of tool you need and, if you pick ELK, the architecture layout, is determined by your organization’s needs and use case. For more information on working with ELK, connect with us here.
Disclaimer: The opinions expressed in this article are those of the author(s) and do not necessarily reflect the positions of Dexlock.


