Let's Discuss
Enquire NowExplaining Explainable AI: A Brief Insight
Sep 13, 2022by, Unnimaya Dinesan
Technology
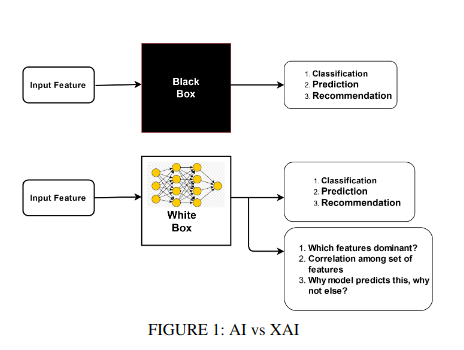
One of the most popular subjects in the world of machine learning is explainable AI. Machine learning models are frequently viewed as opaque “black boxes” that are impossible to understand. These models are ultimately employed by people, who have to have faith in them, comprehend the mistakes they make, and comprehend the logic behind their predictions. In this article, we will examine what Explainable AI is, why it is significant, and some real-world instances of how it can be accomplished.
What is Explainable AI(XAI)?
Artificial intelligence (AI) application approaches and techniques are referred to as Explainable artificial intelligence(XAI) when they allow humans to understand the solution’s outcomes. XAI may be an implementation of the social right to explanation. By fostering end users’ confidence in the AI’s judgment, XAI can enhance the user experience of a good or service. In this manner, XAI seeks to explain what has been done, what is being done right now, and what will be done next and reveal the data upon which the actions are based.
(i) Explainable AI with SHAP
SHAP (Shapley Additive Explanations) is a method used to comprehend why your model makes certain predictions. Interpretability and accuracy trade-off in many of the situations where we deal with models that have competing objectives.
So, in order to compare different models and select one that is precise and understandable, we should employ a metric.
By calculating each feature’s contribution to the prediction, this approach seeks to explain the prediction of an instance or observation. The Shapley value is, in its broadest sense, the average marginal contribution of a feature value overall potential coalitions. Shapley values must be calculated from N! possible order combinations if there are N features, which makes the model an NP-hard issue.
Shap library saves us from having to deal with the specifics of the computation and makes it happen very quickly.
Comparatively speaking to other methods, it is practical and trustworthy because values are computed based on a credible theory.
For model explainability, SHAP offers a variety of visualization methods. For any ML method, you can utilise the SHAP framework. Every single machine learning algorithm is supported by a SHAP Explainer. When creating a tree-based ML model, for example, you can utilise the TreeExplainer() function. In the event that you are developing deep learning models, you can utilise DeepExplainer().
Choosing the appropriate explanation for a given ML model is crucial. You may use SHAP to supplement XAI and boost performance.
To illustrate how features affected the output of the ML model, you can use several charts to describe specific predictions.
- SHAP Summary Plot
- Dependence Plot
- Decision Plot
- Force Plot
Installation: pip install shap
Now let’s examine how we can apply a SHAP explainer to an xgb model.
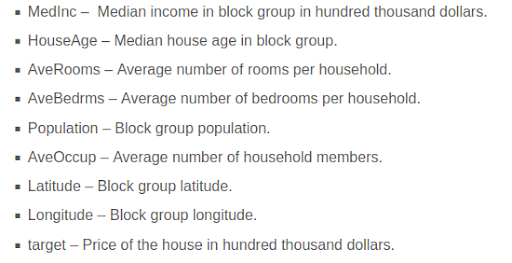
We can use a dataset as per our requirement or choice. I have used California Housing Data, which is a regression dataset. This dataset comprises eight features and the label “target.” Here are the specifics of the characteristics.
An xgb model can be defined as below:
#import necessary libraries

import xgboost as xg
from sklearn.metrics import r2_score
import shap

#defining xgb model.

xgb = xg.XGBRegressor(n_estimators=200, max_depth=5, random_state=0)
xgb.fit(X_train, y_train)
y_pred = xgb.predict(X_test)
test_r2_score = r2_score(y_test, y_pred)

xgb.fit(X_train, y_train)
y_pred = xgb.predict(X_test)
test_r2_score = r2_score(y_test, y_pred)
There are explanatory groups in SHAP for various types of data (tabular, text, images etc.) We do, however, have model-specific explainers within these explainer categories. For example, we have TreeExplainers for models based on trees.
exp = shap.TreeExplainer(xgb) #Tree Explainer
shap_values = explainer.shap_values(X_test) #Calculate shap Values
shap.initjs()
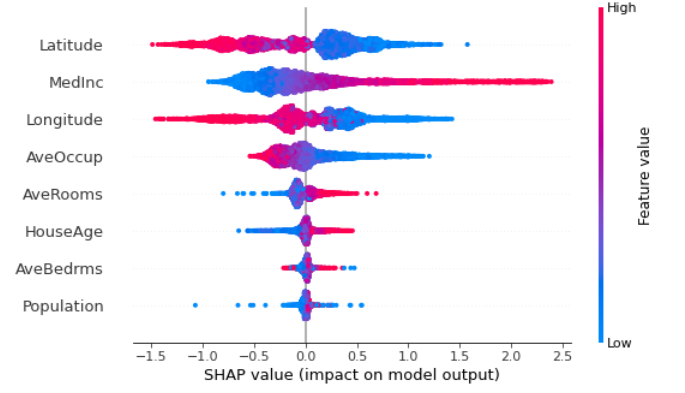
The Global Feature Importances can be determined by SHAP automatically using summary graphs. Therefore, once the shapely values have been determined, a summary plot that shows the impact (both positive and negative) of a feature on the target is a suitable way to illustrate the overall feature relevance.
shap.summary_plot(shap_values, X_test)
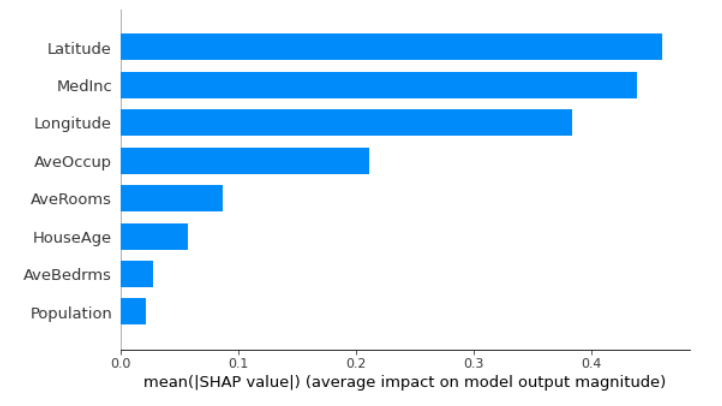
To determine the mean of the absolute values of the feature importance, we can plot this as a bar plot:
shap.summary_plot(shap_values, X_test, plot_type="bar"
Result:
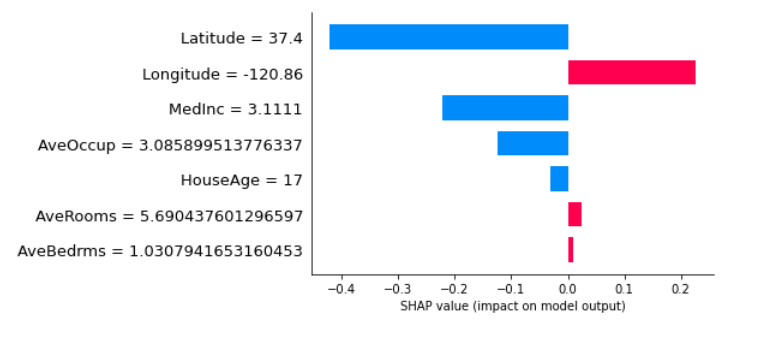
Feature(s) that have an impact on the predictions are depicted visually in a force plot:
shap.force_plot(exp.expected_value,shap_values[1000], features = X_test.iloc[1000, :], feature_names= X_test.columns)

While the blue arrowed characteristics pull the target in the opposite direction, the red arrowed features raise the target.
A bar plot is an additional method of display:
shap.bar_plot(shap_values[1000], features = X_test.iloc[1000, :], feature_names= X_test.columns)
Conclusion
Now that you can create reliable models, you can give decision-makers and other stakeholders better visibility and comprehension of the justifications for the choices that resulted in the models’ output.If you have any projects regarding the above, contact us.
Disclaimer: The opinions expressed in this article are those of the author(s) and do not necessarily reflect the positions of Dexlock.


