Let's Discuss
Enquire NowNatural Language Interfaces for Data Visualization
Jul 6, 2022by, Deepak Thomas Kuncheria
Data Science
NLP
Natural language has emerged as a promising interaction paradigm for data analysis. Designing and implementing these systems is a challenging task, even though there has been considerable progress. These systems have evolved to assist users in answering their questions by suggesting or modifying visualizations.
Given the prevalence of smart speakers like Amazon Echo, and Google Home and voice-based assistants like Siri and Alexa in our everyday lives, interacting with devices using natural language has become quite the norm. One reason why these systems use natural language is that people find it easier to express their questions and intents more freely using verbal language.
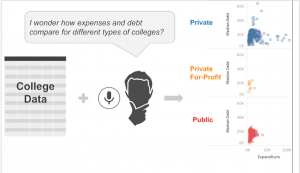 Figure 1: Natural Language Interfaces utilizes the user’s data to create visualizations that will help to solve the user’s questions.
The increasing demand for data visualization tools has led both commercial vendors and academic researchers to explore natural language interfaces (NLIs) for data analysis with visualization. Software giants like Microsoft, IBM and Tableau have offered NLIs that allow users to directly communicate their questions using natural language. This means given a user question or command, these systems try to interpret the underlying intent and parameters corresponding to those intents and map them to appropriate system actions such as creating new or updating existing visualizations.
The Articulate system provided a NLI tool for visualization that maps user queries to tasks and together with data attributes to generate visualizations. Then another system from DataTone allows people to generate visualizations using natural language queries. Eviza is another system, which gives a visualization to the users and questions are formed from it. If the person continually revises and updates their queries, the system seeks to supply an upscale dialogue with the visualization.
Now users opt to use NLIs because systems like Tableau and Power BI are powerful visualization tools that allow people to interactively pose and answer their analytical questions. These tools require people to translate the questions in their minds into operations or actions supported by the tool. Natural language can overcome these issues by allowing users to precise their questions in their own terms.
Now you all will be thinking “natural language is an easier way to get started with a visualization tool” , which begs the question, what prevents it from being the primary way we interact with visualization tools today?
Challenges In NLIs
Implementing NLIs is challenging since we’d like to create software that first interprets the human language as other humans would then perform an appropriate set of actions supporting its interpretation. Below are the subset of challenges these systems pose:
- Ambiguity
- Underspecification
- Preserving context to support an analytic flow
Ambiguity: User questions are often ambiguous and underspecified. For example let’s take a look at the dataset of Olympic games for 10 years using an NLI. If we use this particular question “show me medals for hockey and skating by country.”, this question presents multiple ambiguities. The word medals can be mapped to either the entire number of medals or specific sorts of medals (e.g. gold). Another ambiguity is the fact that there might be multiple types of one sport like for hockey there is another sport called field hockey.
Underspecification: refers to cases where the input query lacks enough information for the system to make a decision. For instance, when exploring a dataset about the population and associated economic metrics of different countries, one might wonder about the gross domestic product (GDP) of different countries and ask the question “What’s the correlation of GDP?” This question could also be clear to the user but from the system’s standpoint, it’s both ambiguous and underspecified.
The proposed solutions to the above two problems are one to use multimodal input and second to use techniques to infer missing details in a query based on the meaning and usage frequency of different data attributes as well as constraints imposed by the system’s supported operations which was devised by Tableau see figure 2. In multimodal input, for a given query the system tries to identify ambiguous phrases. These phrases can be found by using string matching and word association algorithms, which are then displayed through ambiguity widgets allowing users to refine their queries and resolve the ambiguity.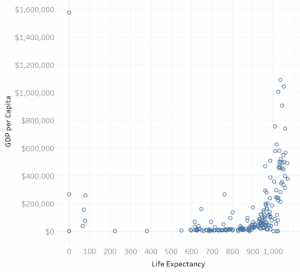
Figure 2: Tableau’s response to the question “What’s the correlation of GDP?”
Preserving context to support an analytic flow: For NLIs to have proper analytic flow, the context of questions has to be understood. Users often need to iterate upon their questions and refine existing visualizations. Supporting such actions implies that the system should be ready to support a “conversation” between the user and therefore the data. A key component of supporting a conversation is interpreting the context during which a question is posed. In other words, additionally to interpreting the present query, the system also must consider previously issued queries (to identify data attributes and values used) and therefore the active view (e.g., visualizations, colors) so it can answer questions effectively. Conversational centering techniques have been created to support these types of interactions.
Opportunities
- Mixed-initiative Interaction: models human-machine interaction after human collaborative problem solving, rather than being viewed as a series of commands, the interaction involves defining and discussing tasks, exploring ways to perform the task, and collaborating to urge it to be done. Both DataTone and Eviza have explored the utilization of mixed-initiative interaction via ambiguity widgets. Ambiguity widgets (dropdowns and sliders etc) help to modify or correct generated responses. An open opportunity for these systems to explore is leveraging mixed-initiative interaction to coach themselves and improve over time. Systems can leverage user interactions (including modifications and corrections made in responses) to find out more about the users themselves. By learning from, and about users, these systems can present more personalized responses and avoid repeating mistakes in responses over time.
- Natural language as input output: This means to enrich visualizations with language and use language as an output modality. However, with increasing concerns regarding the moral dimensions of visualization research concerning automated analysis, a stimulating opportunity lies in leveraging NLG to speak the logic behind the system’s actions in order that it can build trust within the users’ mind which leads to better decision making.
Conclusion
We briefly discussed some existing NLIs for data visualization, and highlighted some challenges faced by using NLIs. Then we discussed new opportunities in the field of NLIs. If you would like to know more about our resources regarding NLI’s, click here.
Disclaimer: The opinions expressed in this article are those of the author(s) and do not necessarily reflect the positions of Dexlock.


